Follow @trevorwithdata Adobe Analytics Classifications is one of the most useful and popular features of Adobe Analytics, allowing you to upload meta-data to any eVar, prop, or campaign that you may be recording in Adobe Analytics. Classifications are useful when you need to do things like: Classify your marketing campaign tracking codes into their respective marketing […]
Author: Trevor Paulsen

Propensity Scoring in Adobe Analytics Using Data Feeds and R
Follow @trevorwithdata When I was a kid, my favorite TV gameshow was “The Price Is Right” – it’s flashy, fun, and to this day I still love watching it – that is except for one thing: the ads. I still find it obnoxious to be bombarded by annoying (and sometimes gross) TV ads about hemorrhoid […]

Algorithmic Bot Filtering in Adobe Analytics Using R
Follow @trevorwithdata Over the last few years, I’ve noticed a marked increase in the number of companies that are worried about their analytics data becoming contaminated with non-human traffic – and with good reason. According to a fairly recent report from Imperva, websites that have more than 100k human visitors everyday should expect nearly one […]

Importing Statistical Models from R into Adobe Analytics Using Customer Attributes
Follow @trevorwithdata One of the most common problems I hear from data scientists is that it’s incredibly difficult to make a statistical model useful to an entire organization. Oftentimes, a skilled data scientist will build an awesome model and do some amazing analysis, only to have it wind up in some Power Point presentation that […]

Clustering Your Customers Using Adobe Analytics Data Feeds and R
Follow @trevorwithdata Theodore Levitt was a famous Harvard economist who is famous for his definition of corporate purpose, which he proposed was not merely making a profit, but instead creating and keeping customers. One of my favorite quotes comes from his book, The Marketing Imagination, in which Levitt says, “If you’re not thinking segments, you’re not thinking.” […]

Use R to Statistically Pick Your March Madness Bracket!
Follow @trevorwithdata March Madness is upon us! I’ve been using statistical models to predict my March Madness bracket for about 6 years (sometimes fairly successfully), and this year I’ve decided to post the statistical tool online for anyone to use for any last minute bracket adjustments. Click here for the full screen version. Here’s how […]

Visitor Level Aggregations Using R and Adobe Analytics Data Feeds
Follow @trevorwithdata Visitor level aggregations (or as I like to call them, “visitor rollups”) are one of the most useful and meaningful things you can do with an Adobe Analytics data feed. If you ever want to do cluster analysis to find interesting marketing segments, propensity modeling to find likely converters, or product affinity analysis for cross […]

How to Setup Adobe Analytics Data Feeds
Follow @trevorwithdata As of February 16 of this year, you can now setup and manage Adobe Analytics’ data feeds right in the UI. This is super helpful, because you no longer have to rely on Adobe Customer Care to help you set this up! If you don’t know what data feeds are, they’re basically the log […]

How to Setup sparklyr: An R Interface for Apache Spark
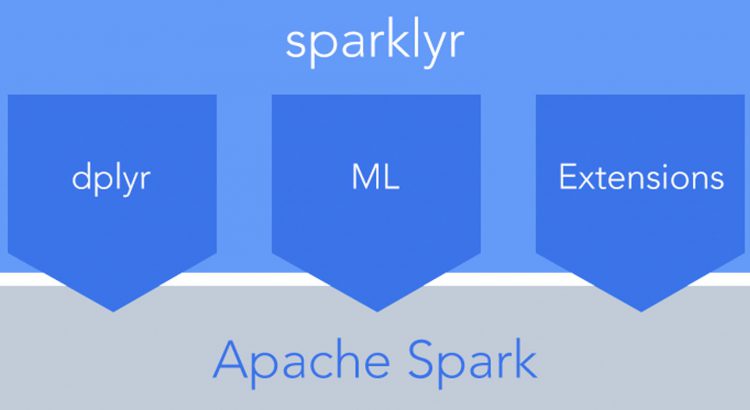
Follow @trevorwithdata If you haven’t heard of Apache Spark yet, I’d be pretty surprised. It’s an amazing open source project that’s changing the way people think about processing big data. That said, in my opinion it has never been super accessible to those of us data enthusiasts who aren’t Java application engineers – that is until […]
